AP Statistics Visuals used in class
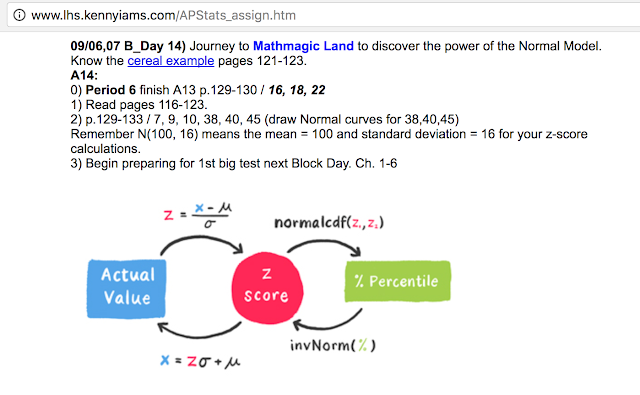
Back in high school, I created some visuals to help me learn AP Statistics. I am proud to say that the AP Statistics instructor has now included them in his curriculum.
I especially like this bottom one because it is a fun memorable way to remember lurking variables. While at first glance it may seem like having more TV's increases a country's life expectancy, with further thought it is clear that the lurking variable of wealth is affecting both of these.
I am really happy to know that my visuals are now going on to help other students for years to come.


Comments
Post a Comment